
- Tracks more than 1,900 reservoirs across the U.S.
- Provides updates every few days instead of monthly.
- Helps water managers plan during drought conditions.
- Available to the public online for free.
Tuesday, August 26, 2025 — Last week, NASA announced a tool that allows scientists and water managers to track U.S. reservoir storage more closely than ever before. The system, called Sub-weekly Area of Reservoirs from Analysis of HLS for the Continental U.S. (SARAH-CONUS), uses satellite data to monitor surface water in over 1,900 reservoirs every few days.
The tool was developed by researchers at Texas A&M University in partnership with the Landsat program. Their peer-reviewed study was published in June in Geophysical Research Letters. The research team combined Landsat and Sentinel-2 satellite data through a process called Harmonized Landsat and Sentinel-2 (HLS). By applying a machine-learning model, the system identifies water, land, ice, and clouds, producing a near real-time picture of reservoir conditions.
Accuracy Tested Against On-the-Ground Data.
To check accuracy, the researchers compared their satellite-based measurements against actual readings from 240 reservoirs across the United States. The results showed a close match, with a correlation of 0.98, meaning the tool provides reliable estimates.
This level of detail marks a significant improvement over older methods, which often relied on monthly updates or had gaps in coverage due to cloud interference. HLS satellite data refreshes every 1.6 days on average, enabling SARAH-CONUS to capture seasonal and short-term changes in water storage that might otherwise be missed.
Applications for Drought and Agriculture.
Reservoirs are essential for drinking water, hydropower, irrigation, and flood control. By offering near real-time data, SARAH-CONUS can help water managers make informed decisions during drought or flooding. The tool also provides early warning signs for drought conditions, giving farmers valuable time to adjust irrigation schedules.
Available Online.
The dataset is publicly accessible and can be explored through the Texas Data Repository. Anyone interested in water conditions, from scientists to agricultural planners, can use the tool at:
https://dataverse.tdl.org/dataset.xhtml?persistentId=doi:10.18738/T8/4BMYBP
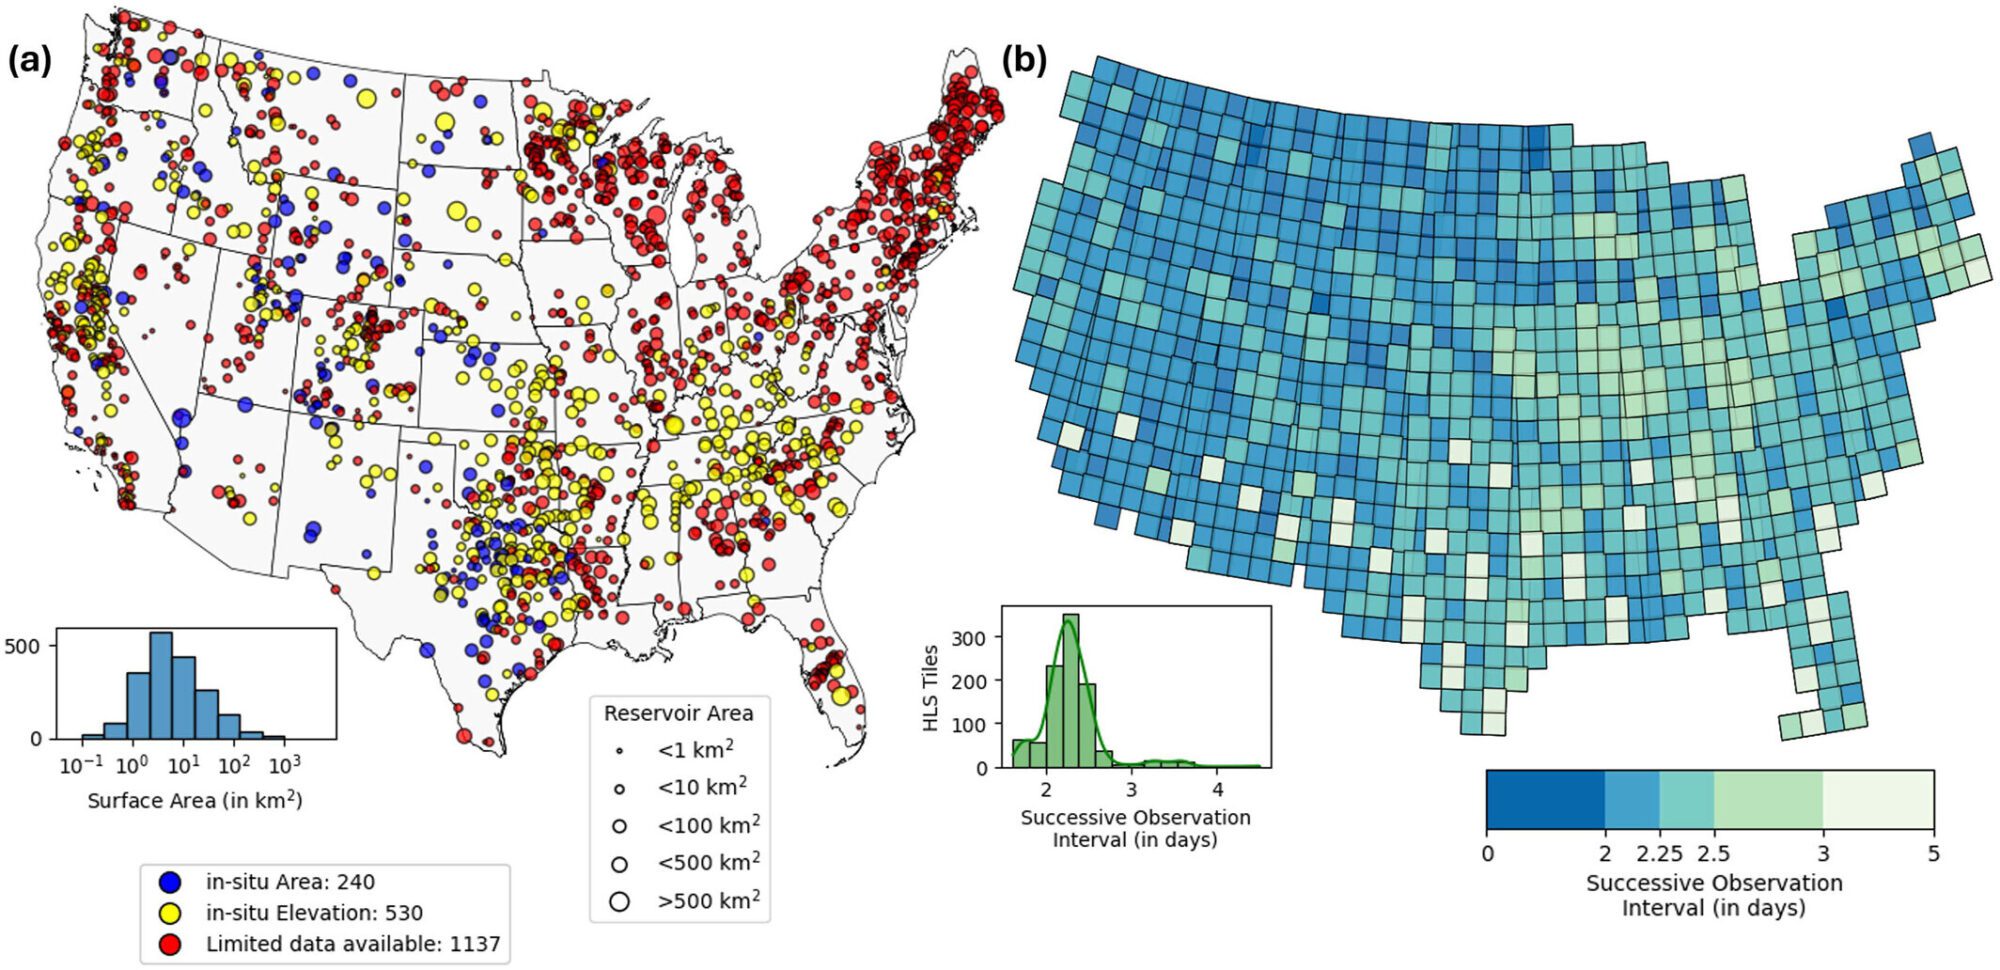
Reservoir distribution and observation frequency in the Continental U.S. The map on the left categorizes reservoirs by data availability, with blue representing reservoirs with in-situ surface area, yellow as those with in-situ elevation data, and red as those with limited data. The map on the right shows HLS raster coverage, with darker shades indicating more observations available. Credit: Yadav et al., 2025