- Scientists produced a high-resolution map of groundwater depth across the contiguous United States.
- The analysis is based on more than one million groundwater well measurements collected between 1914 and 2023.
- The study estimates more than 300,000 cubic kilometers of groundwater storage above deep bedrock.
- Roughly 40% of the land area has groundwater within 10 meters of the surface.
- Coarse national maps can significantly underestimate shallow groundwater conditions.
- Uncertainty is higher in arid western regions than in the more humid eastern United States.
Thursday, February 5, 2026 –– Groundwater is often described as the largest accessible freshwater supply on Earth, but its depth and availability can vary sharply over short distances. A peer-reviewed study published January 14, 2026 in Communications Earth & Environment focuses on this challenge, noting that groundwater conditions frequently change at scales far smaller than most national or global mapping tools can capture.
As the authors explain, “Groundwater has large spatial variability, which poses challenges for management.” That variability matters because groundwater decisions are made well by well, field by field, and community by community.
The study highlights a long-standing gap in groundwater science, stating that “Estimating actual water table depths, including anthropogenic impacts, at high resolution remains a challenge.” The research is aimed at narrowing that gap.
How the map was created.
Researchers used a machine-learning approach known as a random forest model to estimate water table depth across the contiguous United States at an approximate resolution of 30 meters. The model was trained using long-term average groundwater depth measurements from more than one million wells, combined with climate data, terrain information, and subsurface characteristics.
According to the study, the model achieved a strong statistical fit when compared with independent test data, with a national-scale correlation of 0.79 and an average error of just under 15 meters. The authors emphasize that the approach is not intended to replace physically based groundwater models. Instead, they describe it as a complementary tool that can help bridge the gap between sparse well data and broad regional models.
“This study does not propose replacing physically based models with machine learning,” the authors write, emphasizing that each approach serves a different role.
What the study found about groundwater storage.
Using the high-resolution water table map along with published estimates of subsurface porosity, the researchers calculated total groundwater storage above a depth of 392 meters. That depth was selected because reliable porosity data are available above it and because it roughly corresponds to the zone of active groundwater circulation.
The study estimates total groundwater storage of approximately 306,500 cubic kilometers, with an uncertainty range between 291,850 and 316,720 cubic kilometers. These values represent groundwater stored beneath the contiguous United States, not annual supply or recharge.
One of the most striking findings involves shallow groundwater. The analysis indicates that about 40% of the land area has groundwater within 10 meters of the land surface, while 16% has groundwater within 5 meters. Shallow groundwater, the authors note, is “critically important” because it is closely connected to streams, vegetation, and surface conditions.
Why resolution matters.
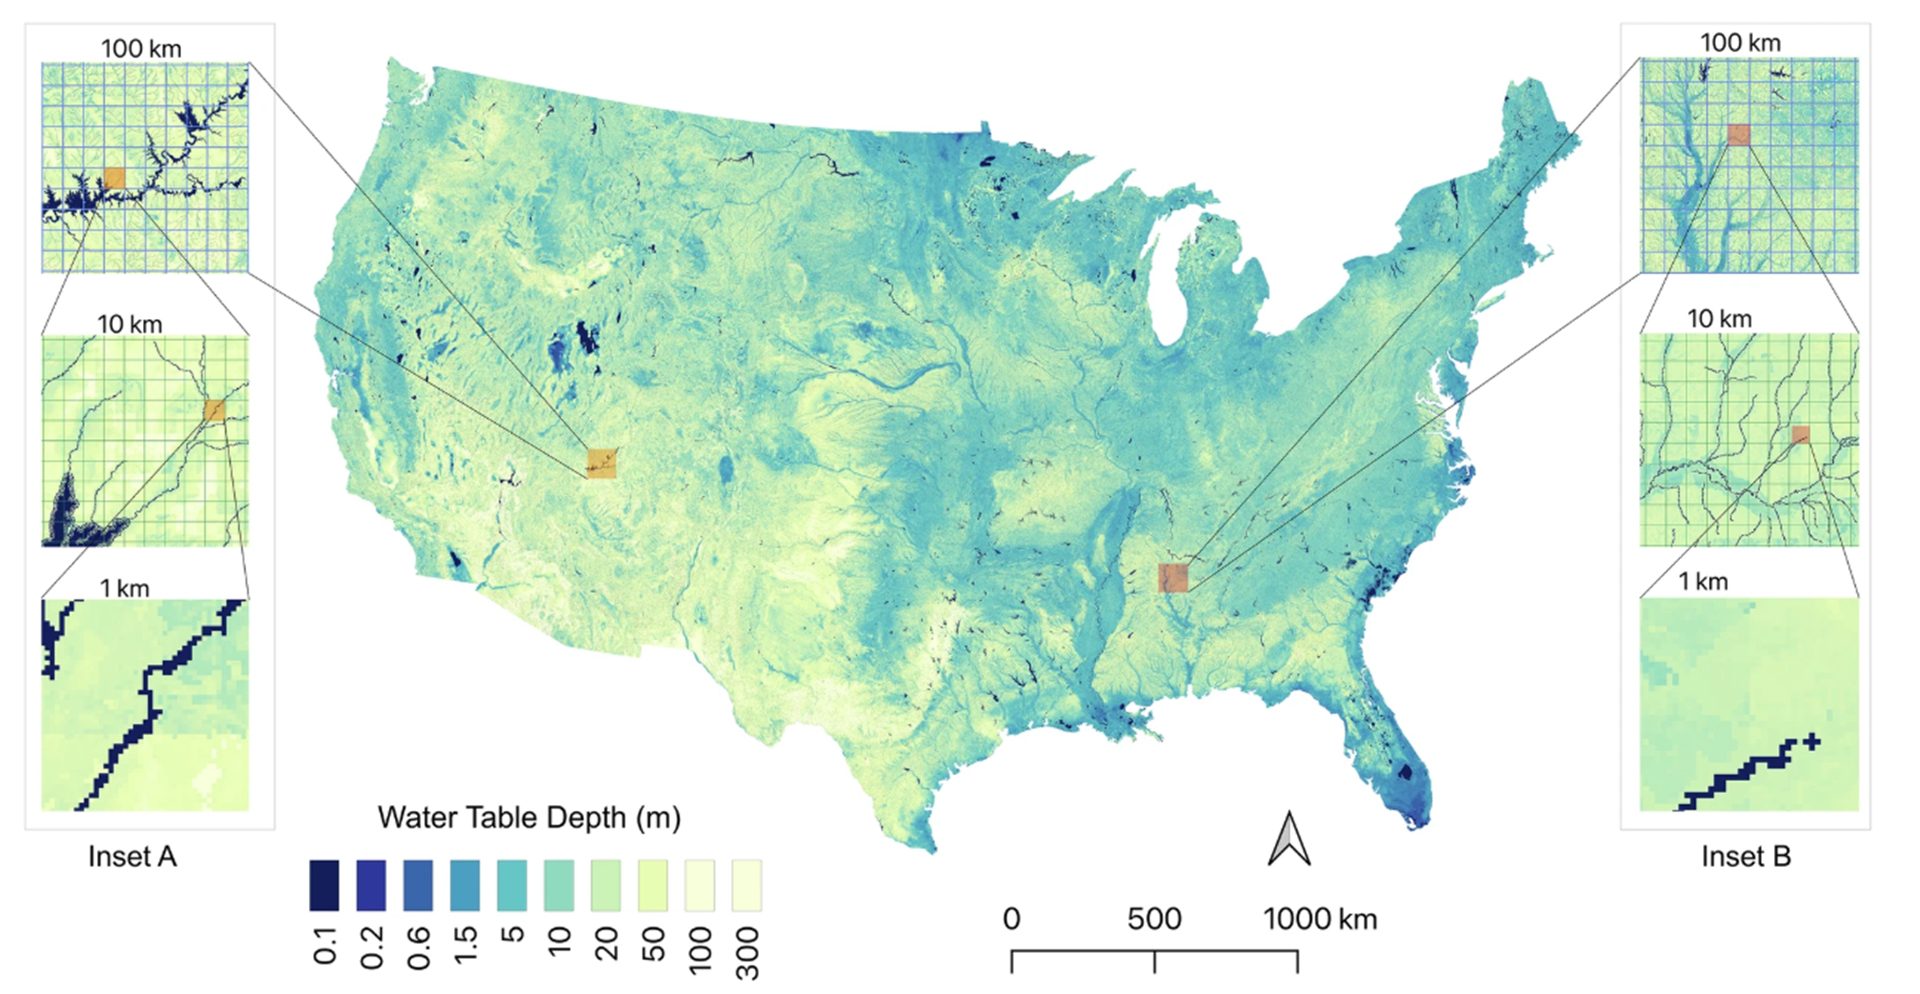
The study examined how groundwater estimates change when map resolution becomes coarser. As resolution decreased from approximately 30 meters to 100 kilometers, fine-scale features such as stream-connected groundwater zones disappeared from the maps.
This loss of detail affected storage estimates. Total groundwater storage increased from roughly 252,000 cubic kilometers at very coarse resolution to 306,500 cubic kilometers at high resolution. The difference represents an 18% underestimation when coarse mapping is used in that comparison.
Shallow groundwater was even more sensitive. At coarse resolution, areas with groundwater less than five meters deep accounted for only about 1% of the land area. At high resolution, that figure rose to roughly 12%. Extremely shallow groundwater conditions, less than one meter deep, were largely invisible in coarse datasets.
The authors caution that missing shallow groundwater can bias analyses related to drought sensitivity, flooding risk, and ecosystem response.
Accounting for uncertainty.
Rather than presenting a single definitive map, the study includes uncertainty estimates generated from an ensemble of model runs. These uncertainty ranges vary geographically.
The authors report that uncertainty is generally higher in the arid western United States than in the wetter eastern regions. Land use also matters. Croplands tend to coincide with shallower and more certain groundwater estimates, which the study attributes to agriculture being concentrated in flatter, low-lying landscapes such as river valleys.
How groundwater pumping is reflected.
The well data used in the study span more than a century and include what the authors describe as a “pronounced anthropogenic signal of groundwater pumping.” Because the observations were not adjusted to remove pumping effects, the resulting groundwater depth estimates implicitly include the influence of long-term groundwater withdrawals.
While pumping volumes and locations were not directly included as model inputs, the authors note that the historical well record itself reflects those impacts.
Relevance for the arid West and Colorado River Basin.
Although the study covers the entire contiguous United States, its findings are especially relevant for arid western states, including those in the Colorado River Basin. The analysis confirms that deeper water tables are more common in the West, while also showing that uncertainty is higher in those regions.
The paper underscores the risk of relying solely on coarse groundwater products in arid landscapes, where shallow, surface-connected groundwater features can be locally important but easily missed at large scales.
Citation.
Ma, Y., Condon, L.E., Koch, J. et al. High resolution US water table depth estimates reveal quantity of accessible groundwater. Commun Earth Environ 7, 45 (2026). https://doi.org/10.1038/s43247-025-03094-3
Pictured: Figure 2 from the study: A machine learning approach can synthesize ~ 1 M water table depth observations with high-resolution data products to develop a fine-scale estimate of the quantity and accessibility of groundwater over the US.
Q&A
What is water table depth?
Water table depth refers to how far below the land surface groundwater is located at a specific place.
How detailed is the map used in this study?
The map is produced at an approximate resolution of 30 meters, allowing it to capture local variations that broader maps often miss.
How much groundwater did the study estimate?
The study estimates about 306,500 cubic kilometers of groundwater storage above 392 meters depth, with a defined uncertainty range.
Why do coarse maps underestimate groundwater?
Coarse maps smooth out local features such as shallow valleys and stream-connected zones, which can lead to lower estimates of both shallow groundwater and total storage.
Does the study include the effects of pumping?
Yes. Because the model is trained on historical well measurements that reflect decades of pumping, those impacts are implicitly included in the results.