- Severe droughts cut median annual streamflow by about 15 percent across the study sites.
- Peak flows fell much more sharply, with a basin-wide decline of about 47 percent.
- Water temperatures rose about 9 percent during drought, while specific conductance rose about 5 percent.
- Spring and summer generally showed the strongest effects on streamflow and water quality.
- Many sites had not recovered from the 2018 drought by 2022, after another severe drought followed in 2020 and 2021.
Monday, September 14, 2026 — A new study of the Upper Colorado River Basin offers a detailed look at something water users already know in broad terms: drought means less water in rivers.
But the research goes further. It shows that drought can change not only how much water is flowing, but also the temperature and concentration of dissolved salts in that water. And the effects can vary considerably from one watershed to another.
Researchers examined conditions in the Upper Colorado River Basin from 1998 through 2022, focusing on four severe drought events: 2001-2002, 2012, 2018 and 2020-2021. The study was published in Communications Earth & Environment .
.
The Upper Basin includes Colorado River headwaters in Colorado, Wyoming, Utah and New Mexico. Those waters eventually flow toward Lees Ferry in Arizona.
Less Water, Especially During Peak Flows.
The clearest finding involved streamflow.
Researchers studied streamflow at 202 sites. During drought years, 170 of those sites experienced declines. Across all sites, the median annual decrease was about 15 percent.
The decline was much larger for peak flows.
Peak flows dropped at 199 sites, with a basin-wide decline of about 47 percent. Some individual sites declined by nearly 99 percent. Low flows also declined, but the basin-wide decrease was about 15 percent.
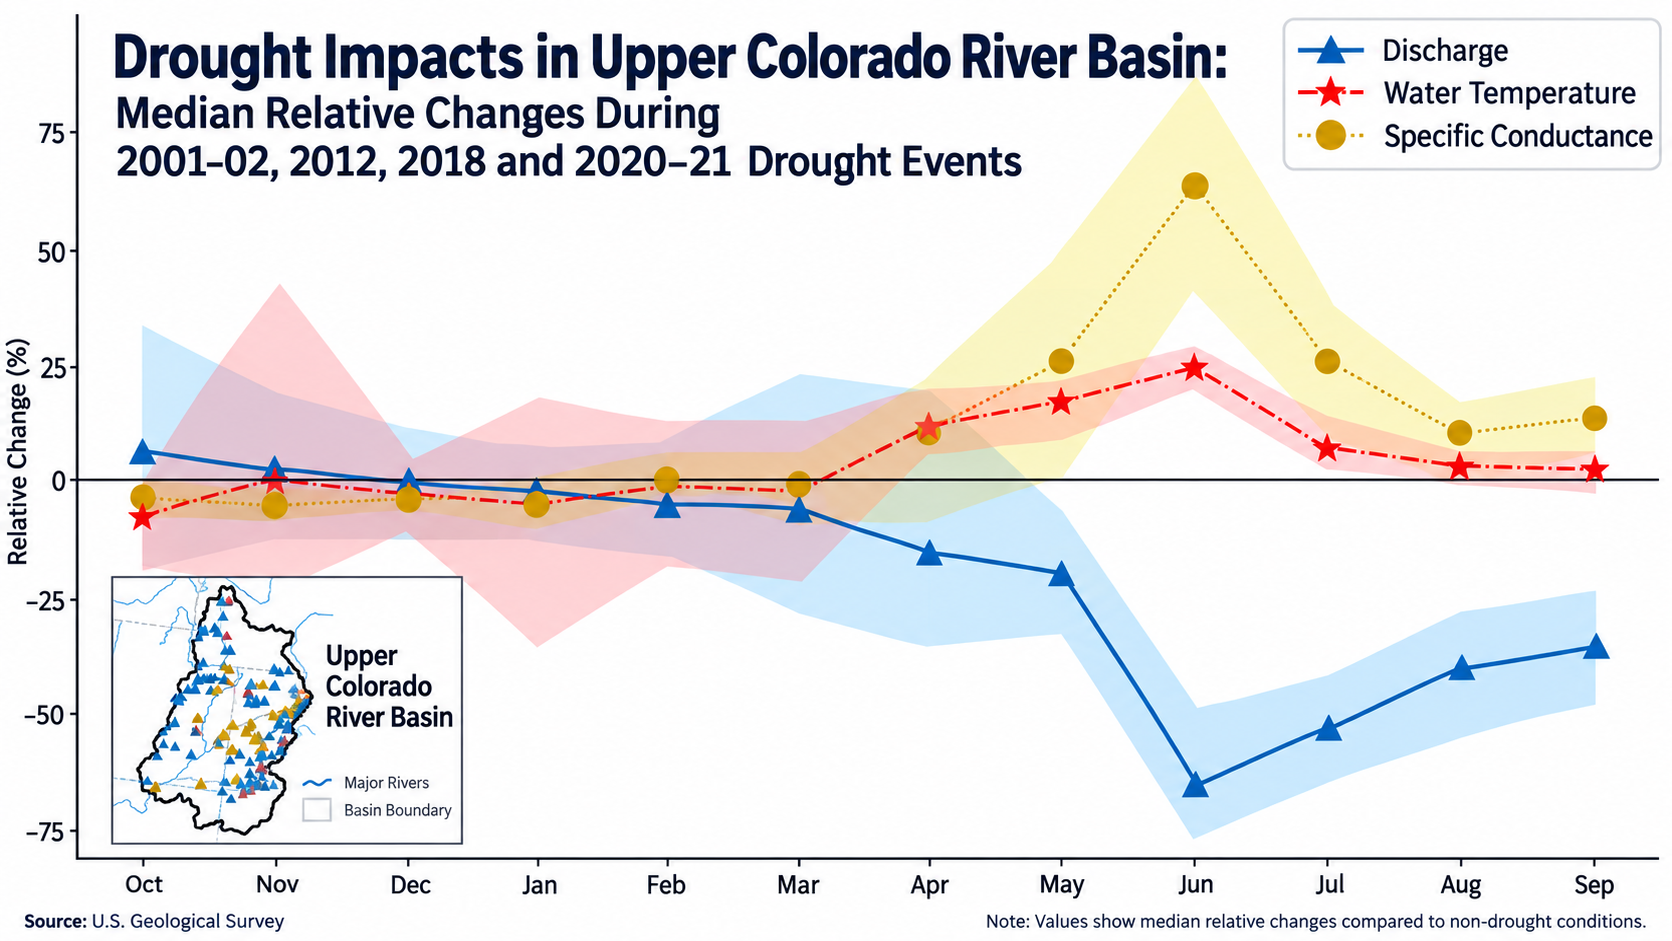
The seasonal pattern was especially striking. Streamflow losses were greatest during summer, averaging 54 percent from July through September. Spring flows declined by about 11 percent from April through June.
That matters in a basin where snow plays such a large role. The researchers noted that mountain snowmelt and groundwater are major sources of streamflow in the Upper Colorado River Basin.
Drought Also Changed Water Quality.
Less water was only part of the story.
At 29 of the 36 sites studied, temperatures increased during drought. The basin-wide median increase was about 9 percent. Individual sites experienced increases as high as 28 percent.
The biggest temperature increases generally occurred during summer, typically peaking in June. Depending on the drought event, summer increases ranged from 17 to 28 percent before temperatures generally returned to reference levels by August.
Researchers also examined specific conductance, a measurement related to the amount of dissolved material in water and used in the study as an indicator of salinity.
Sixteen of 23 monitoring sites experienced increases during drought. The basin-wide increase was about 5 percent, although one site recorded an annual median increase of 45 percent.
The seasonal numbers were more dramatic. Specific conductance began increasing relative to normal conditions in May and remained higher through September. In June 2018, the relative increase reached 86 percent.
Some Watersheds Handled Drought Better.
One of the study’s more important findings is that drought did not affect every watershed the same way.
Researchers found greater streamflow declines in watersheds with higher freshwater withdrawals, greater deciduous forest cover, higher average air temperatures, finer soils and longer periods in which infiltrated water remained underground before reaching a stream.
Other characteristics were associated with smaller streamflow losses.
Watersheds with stronger groundwater contributions and soils that allowed water to soak into and move through the ground more easily tended to be more resilient. The researchers said their findings point to the importance of groundwater storage and recovery in determining how rivers respond to drought.
Human water use also showed up in the analysis. Higher freshwater withdrawals, representing uses such as agriculture, industry and domestic supplies, were associated with greater streamflow declines during drought.
Reservoirs and Groundwater Provided a Buffer.
Reservoirs helped soften some drought effects on river flows.
The researchers found that reservoir releases buffered streamflows during all four drought periods. Reservoir storage, however, declined during drought, and several of the basin’s larger reservoirs remained low for years afterward.
Groundwater also played an important role.
The study found that watersheds with stronger groundwater-fed baseflows generally experienced smaller streamflow declines. Researchers described groundwater and reservoirs as buffers that can help sustain streamflow during drought.
Open water and reservoirs were also associated with smaller increases in specific conductance during drought.
Recovery Usually Takes Time.
The study also examined what happened after drought ended.
For sites where streamflow declined during the 2001-2002 and 2012 droughts, most eventually returned to their earlier levels. The median recovery time was about three years, although some sites took as long as 10 years.
Water temperature recovered more quickly, generally within one or two years.
Specific conductance generally recovered within four years following the 2001-2002 and 2012 droughts. But the pattern changed after 2018. Twelve sites had still not returned to their earlier specific-conductance levels by 2022.
Streamflow recovery after 2018 also differed.
Most sites had not returned to their pre-drought streamflow levels by 2022. The researchers said the severe 2020-2021 drought followed too soon after the 2018 drought to allow the typical three-to-four-year recovery period.
In other words, the study did not find that every drought caused a permanent change. Instead, drought timing mattered. When another severe drought arrived before a watershed had recovered, the effects lasted longer.
Important Limits to the Study.
The researchers cautioned that available data varied considerably.
Streamflow information covered 202 sites, but water-temperature data were available for only 36 catchments and specific-conductance data for 23. Coverage was also uneven across the basin.
Researchers used a computer model to help fill some gaps in water-temperature measurements, but acknowledged uncertainty in those estimates. They did not have a similar method for filling gaps in specific-conductance records.
The study also found that most monitoring sites did not show a statistically significant long-term trend in streamflow, water temperature or specific conductance over the full 1998-2022 study period. The researchers cautioned that their findings differ from studies using longer time periods or comparing recent conditions with those before 2000.
A More Detailed Picture of Drought.
The study paints drought as more than a simple shortage of precipitation.
Across the four severe drought periods, rivers generally carried less water. Peak flows declined sharply. Water temperatures and specific conductance generally increased. But the size of those changes depended partly on the characteristics of individual watersheds, including soils, vegetation, groundwater, reservoirs and human water withdrawals.
Recovery varied as well.
The researchers found that streamflow and specific conductance generally recovered following earlier droughts, while water temperatures usually recovered faster. But the closely spaced droughts beginning in 2018 produced more persistent effects through the end of the study period in 2022.
For a river system built largely on mountain snow, the research provides a closer look at what happens after drought reaches the watershed: not simply less water, but changes in when that water arrives, how warm it becomes and what it carries with it.
Citation.
“Widespread drought-driven declines in streamflows and water quality in the Upper Colorado River Basin during 1998–2022,” Communications Earth & Environment, 2026, Vol. 7, Article 734. DOI: 10.1038/s43247-026-03890-5.
Image from study.