
- The United States added more than 3 million acres of irrigated farmland between 1997 and 2022.
- Western states such as California and Colorado lost irrigated land as water shifted from farms to cities.
- The Midwest, the East, and the Mississippi River Valley added irrigation as rainfall became less reliable.
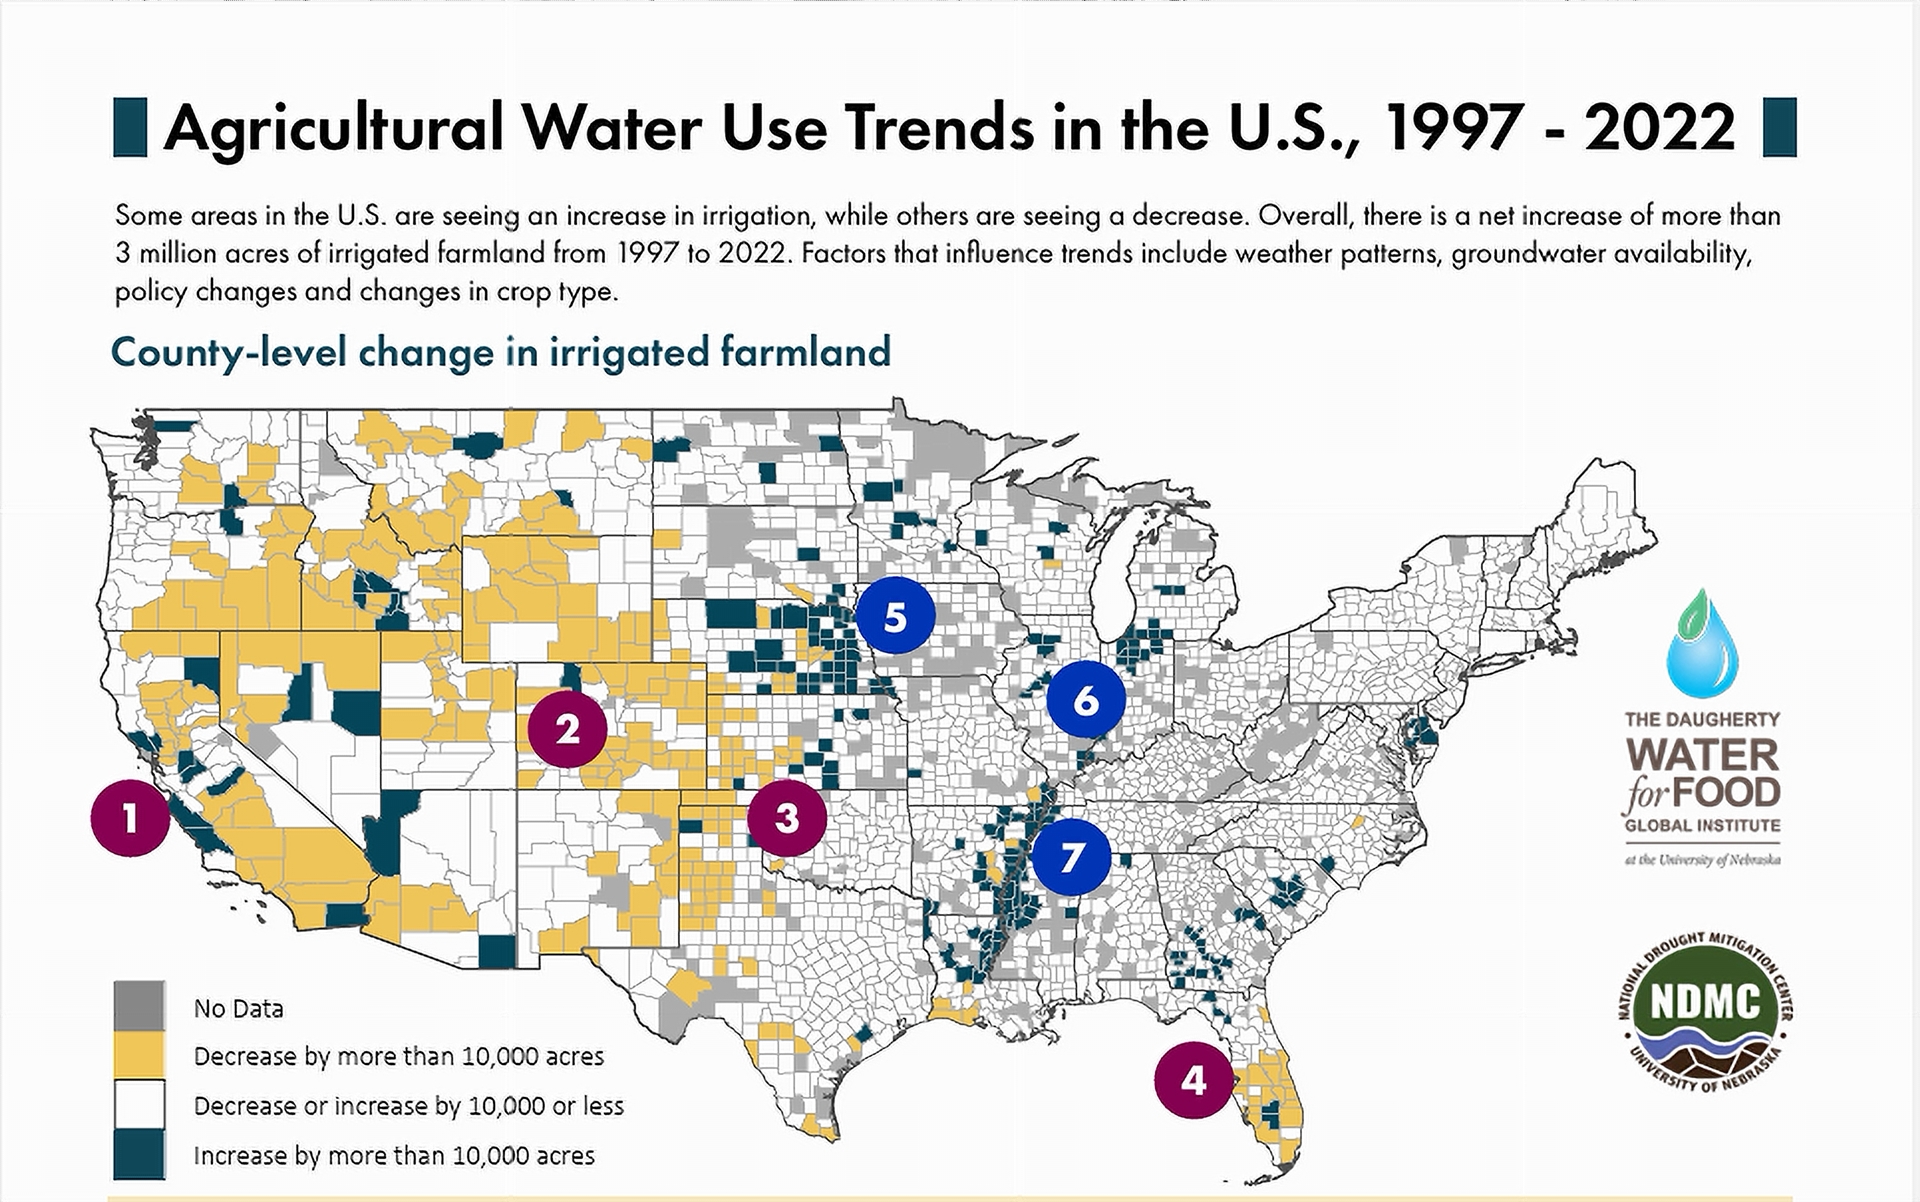
Thursday, August 13, 2026 — A new infographic from the Daugherty Water for Food Global Institute at the University of Nebraska shows how irrigated farmland changed across the United States over 25 years. It compares county-level data from 1997 and 2022. During that time, the country added more than 3 million acres of irrigated farmland. The change did not spread evenly. Some regions gained irrigated land, and others lost it.
The map sorts each county into one of four groups. Gray counties had no data. Gold counties lost more than 10,000 acres of irrigated land. White counties changed by 10,000 acres or less in either direction. Dark blue counties gained more than 10,000 acres.
The publishers list several factors behind the trends. These include weather patterns, groundwater supply, policy changes, and shifts in crop type.
Where Irrigated Land Shrank.
Several Western areas saw irrigated farmland decline.
In California, drought that lasted many years and water transfers to cities reduced the water available for farming. The infographic notes that more cuts are expected as the state works toward goals set by the 2014 Sustainable Groundwater Management Act.
Along Colorado’s Front Range, water moved from farms to cities. This shift helps support the state’s growing population.
In parts of the High Plains, groundwater levels fell. The drop left less water to meet crop needs, so irrigated farmland decreased.
Florida also lost irrigated land, though for a different reason. Residential and industrial development, including solar power projects, converted farmland to other uses.
Where Irrigated Land Grew.
Other regions moved in the opposite direction.
In Nebraska, which generally has plenty of groundwater, irrigated areas grew early in the study period. Drought and high crop prices at that time encouraged the increase. Since then, local policy has limited further expansion across much of the state.
Across the Midwest and the Eastern United States, farms that once relied on rainfall began adding irrigation. This change often responds to rainfall that varies more from year to year.
Along the Mississippi River Valley, irrigation increased to support rice and other crops. The region receives high annual rainfall, but most of it falls outside the main growing season.
About the Data.
The infographic uses two surveys from the United States Department of Agriculture. These are the 1998 Farm and Ranch Irrigation Survey and the 2023 Irrigation and Water Management Survey, both from the department’s National Agricultural Statistics Service. The work was supported by the United States Department of Agriculture Office of the Chief Economist. The publishers state that the findings reflect the views of the authors and do not represent official government policy.
Note: The image for this article is a screenshot of the infographic. Click here for the Daugherty Water for Food Global Institute at the University of Nebraska’s infographic.